Our
Performance
| Financial Year ended March 31 | ||||||
| Particulars | Units | 2011 | 2012 | 2013 | 2014 | 2015 |
| Total Customer Base | 000s | 220,878 | 251,646 | 271,227 | 295,948 | 324,368 |
| Mobile Services | 000s | 211,919 | 241,148 | 259,844 | 283,580 | 310,884 |
| Broadband & Telephone Services | 000s | 3,296 | 3,270 | 3,283 | 3,356 | 3,411 |
| Digital TV Services | 000s | 5,663 | 7,228 | 8,100 | 9,012 | 10,073 |
| Based on Consolidated Income Statement | ||||||
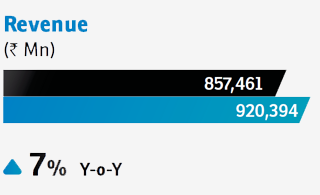
| Revenue | ` Mn | 595,383 | 683,267 | 769,045 | 857,461 | 920,394 |
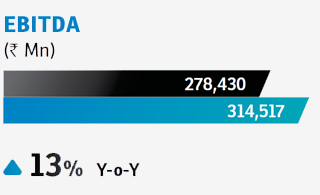
| EBITDA (before exceptional items) | ` Mn | 200,718 | 222,533 | 233,340 | 278,430 | 314,517 |
| Cash Profit from Operations before Derivative and Exchange Fluctuation (before exceptional items) |
` Mn | 180,581 | 193,899 | 195,643 | 241,813 | 285,280 |
| Earnings Before Tax | ` Mn | 76,782 | 63,792 | 47,853 | 78,643 | 107,130 |
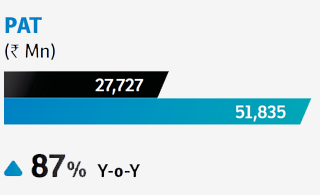
| Net Profit | ` Mn | 60,467 | 42,594 | 22,757 | 27,727 | 51,835 |
| Based on Consolidated Statement of Financial Position | ||||||
| Shareholders’ Equity | ` Mn | 487,668 | 506,113 | 503,217 | 597,560 | 619,564 |
| Net Debt | ` Mn | 599,512 | 618,442 | 583,567 | 605,416 | 668,417 |
| Capital Employed | ` Mn | 1,087,180 | 1,124,555 | 1,086,784 | 1,202,976 | 1,287,981 |
| Key Ratios | ||||||
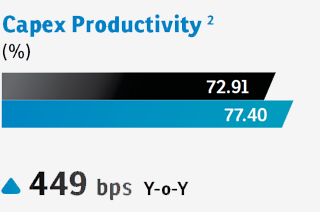
| Capex Productivity | % | 66.93 | 69.17 | 69.12 | 72.91 | 77.40 |
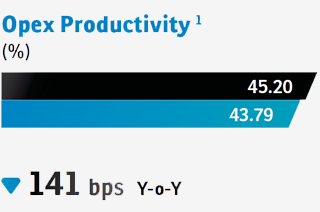
| Opex Productivity | % | 45.13 | 43.84 | 45.43 | 45.20 | 43.79 |
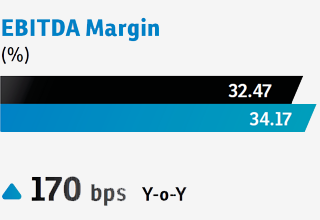
| EBITDA Margin | % | 33.71 | 32.57 | 30.34 | 32.47 | 34.17 |
| EBIT Margin | % | 16.57 | 13.97 | 11.08 | 14.22 | 17.23 |
| Return on Shareholders’ Equity | % | 13.30 | 8.57 | 4.51 | 5.04 | 8.52 |
| Return on Capital Employed | % | 10.79 | 7.06 | 5.68 | 6.65 | 8.05 |
| Net Debt to EBITDA | Times | 2.95 | 2.60 | 2.51 | 2.19 | 2.08 |
| Interest Coverage Ratio | Times | 11.20 | 9.11 | 6.79 | 7.58 | 8.43 |
| Book Value Per Equity Share | ` | 128.41 | 133.27 | 132.51 | 149.49 | 154.99 |
| Net Debt to Shareholders’ Equity | Times | 1.23 | 1.22 | 1.16 | 1.01 | 1.08 |
| Earnings Per Share (Basic) | ` | 15.93 | 11.22 | 6.00 | 7.02 | 12.97 |
| Contribution to Exchequer (India) | ||||||
| Taxes, Duties, Fees and other Levies | ` Mn | 307,999 | 119,082 | 141,513 | 213,324 | 237,688 |
Credible Growth
Cost Efficiency
Expanding Margins
Market Share Growth
Revenue Market Share (RMS) in India stood at 30.7% for FY 2014-15 versus 30.5% in FY 2013-14
Leading the pack on data revenues with data RMS, of ~45% in
FY 2014-15 amongst the top three
India churn maintained under 2.5%*, Africa churn reduced to 5.8%*
* Churn numbers reported are year-end numbers

1
- 141 bps improvement in operational productivity on an year-on-year basis
- This is computed by dividing the operating expenses by the total revenues for the respective period. Operating expenses is the sum of (i) employee costs (ii) network operations costs and (iii) selling, general and administrative costs. This ratio depicts the operational efficiencies in the Company.
2
- 449 bps increase in capex productivity on an year-on-year basis
- This is computed by dividing revenue for the period by gross cumulative capex (gross fixed assets and capital work in progress) till date i.e. the physical investments made in the assets creation of the Company. This ratio depicts the asset productivity of the Company.
© Airtel India 2015, all rights reserved
Follow us on : 

